Using Statistics
Consider the different possible orderings of boy (B) and girl (G) in three sequential births.There are 2*2*2=23 = 8 possibilities, so the sample space is:
| BBB | (3) | GBB | (2) |
| BBG | (2) | GBG | (1) |
| BGB | (2) | GGB | (1) |
| BGG | (1) | GGG | (0) |
Note the following:
- each possible outcome is assigned a single numeric value
- all outcomes are assigned a numeric value, and
- the value assigned varies over all possible outcomes.
A random variable, X, is a function that assigns a single, but variable, value to each element of a sample space.
See the illstration below:
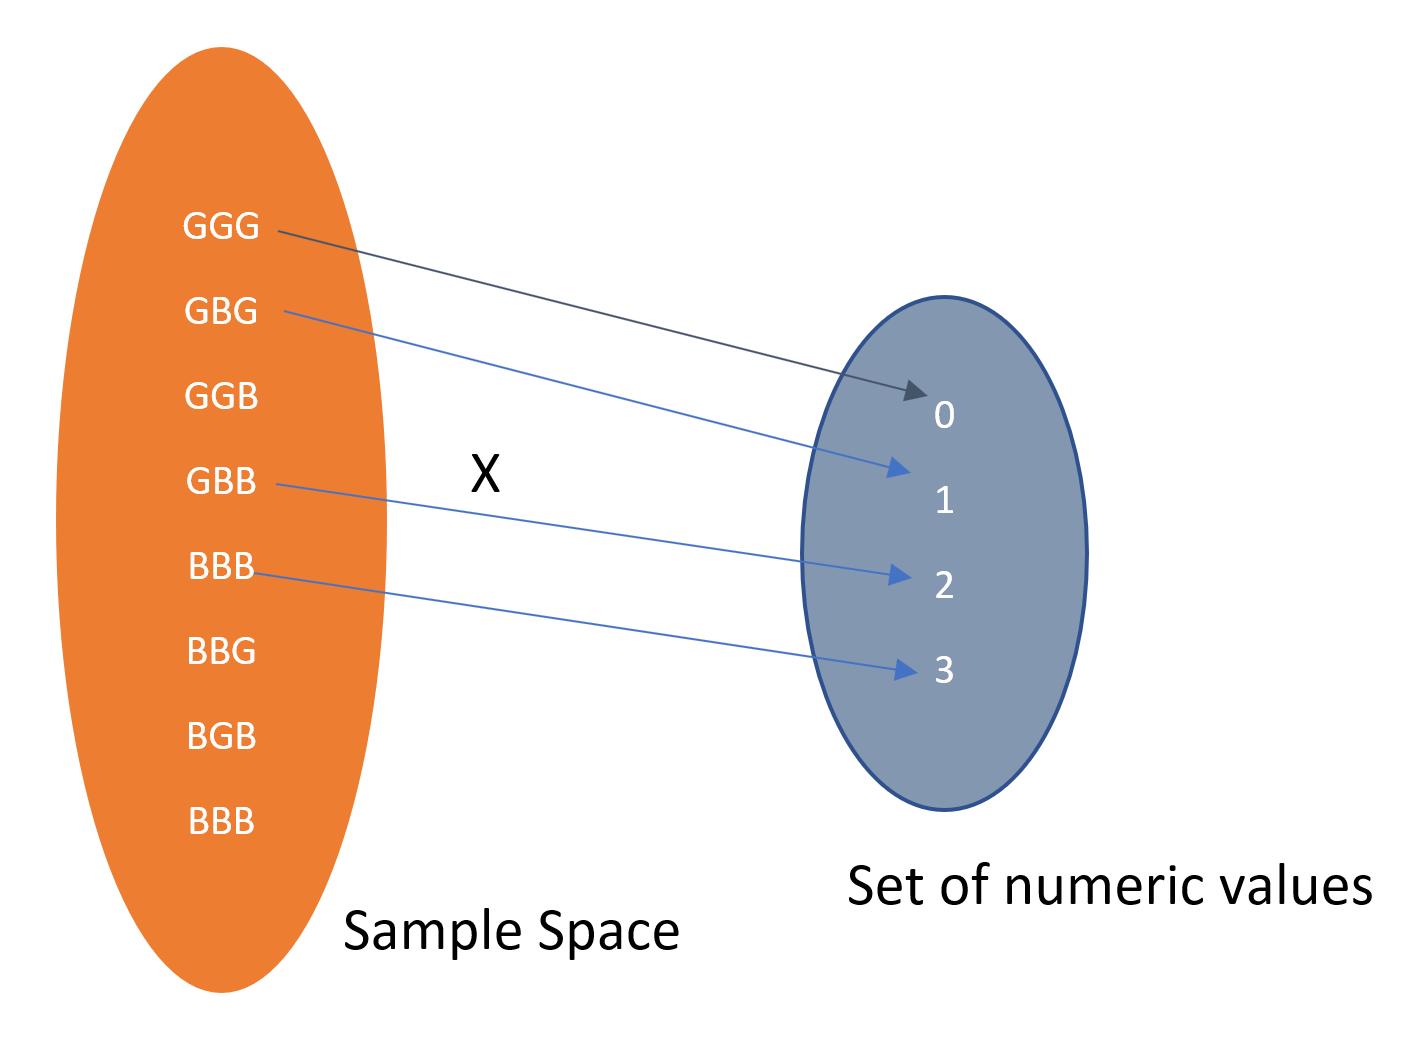
Since the random variable X = 2 when any of the three outcomes BBG, BGB, or GBB occurs,
P(X = 2) = P(BBG) + P(BGB) + P(GBB) = 3/8
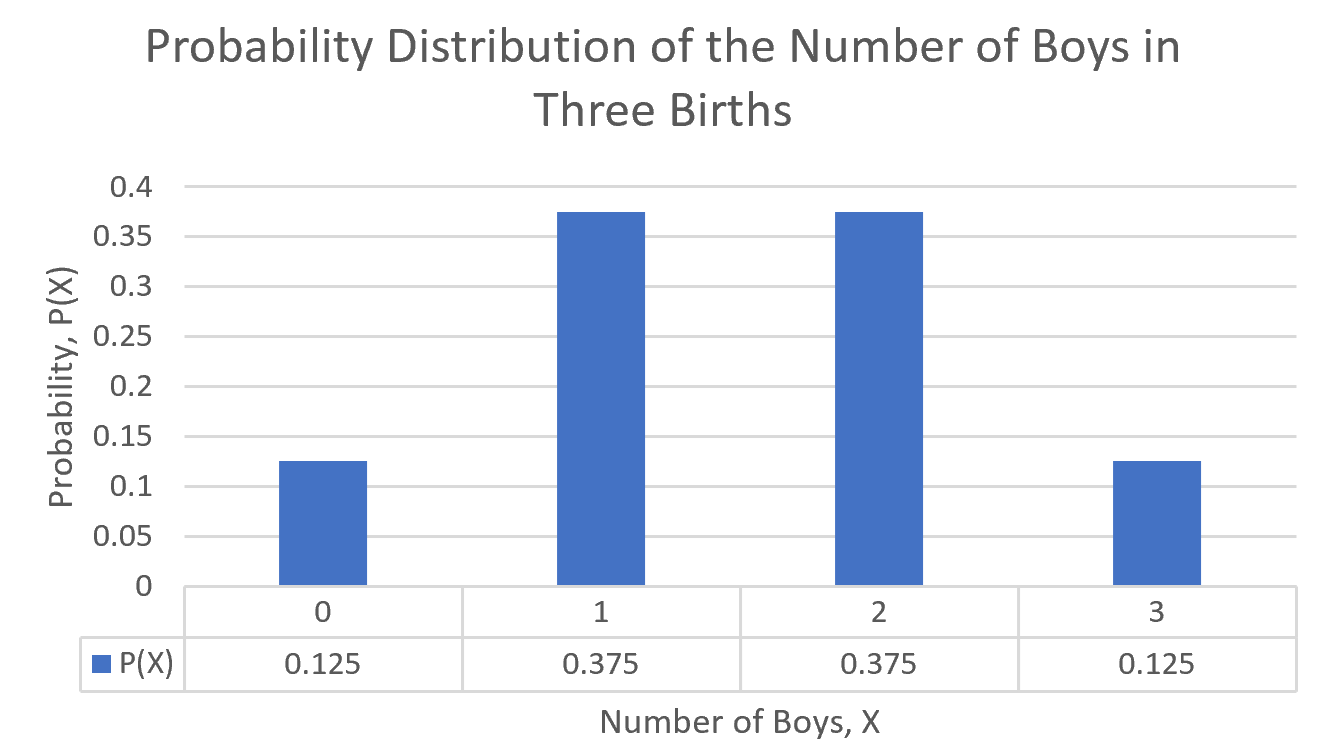
The probability distribution of a random variable is a table that lists the
possible values of the random variables and their associated probabilities.
| x | P(x) |
|---|---|
| 0 | 1/8 |
| 1 | 3/8 |
| 2 | 3/8 |
| 3 | 1/8 |
| Sum of P(x) = 8/8=1.0 |
The Graphical Display for this Probability Distribution is shown below:
Examples
Example 1
Consider the experiment of tossing two six-sided dice. There are 36 possible outcomes as illustrated below: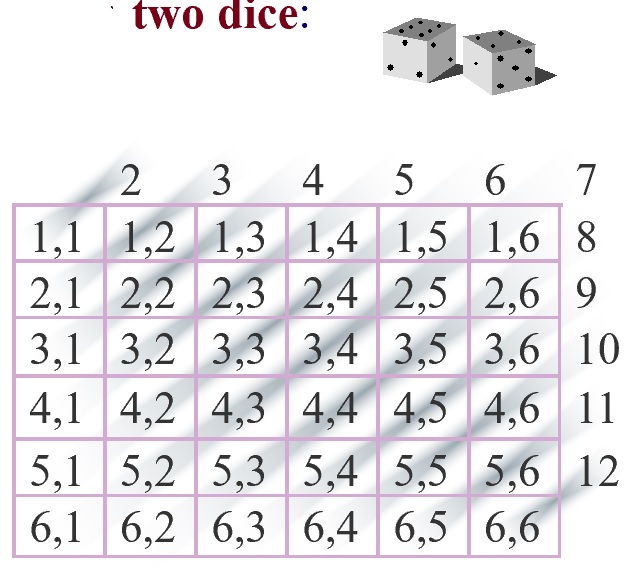
Let the random variable X represent the sum of the numbers on the two dice:
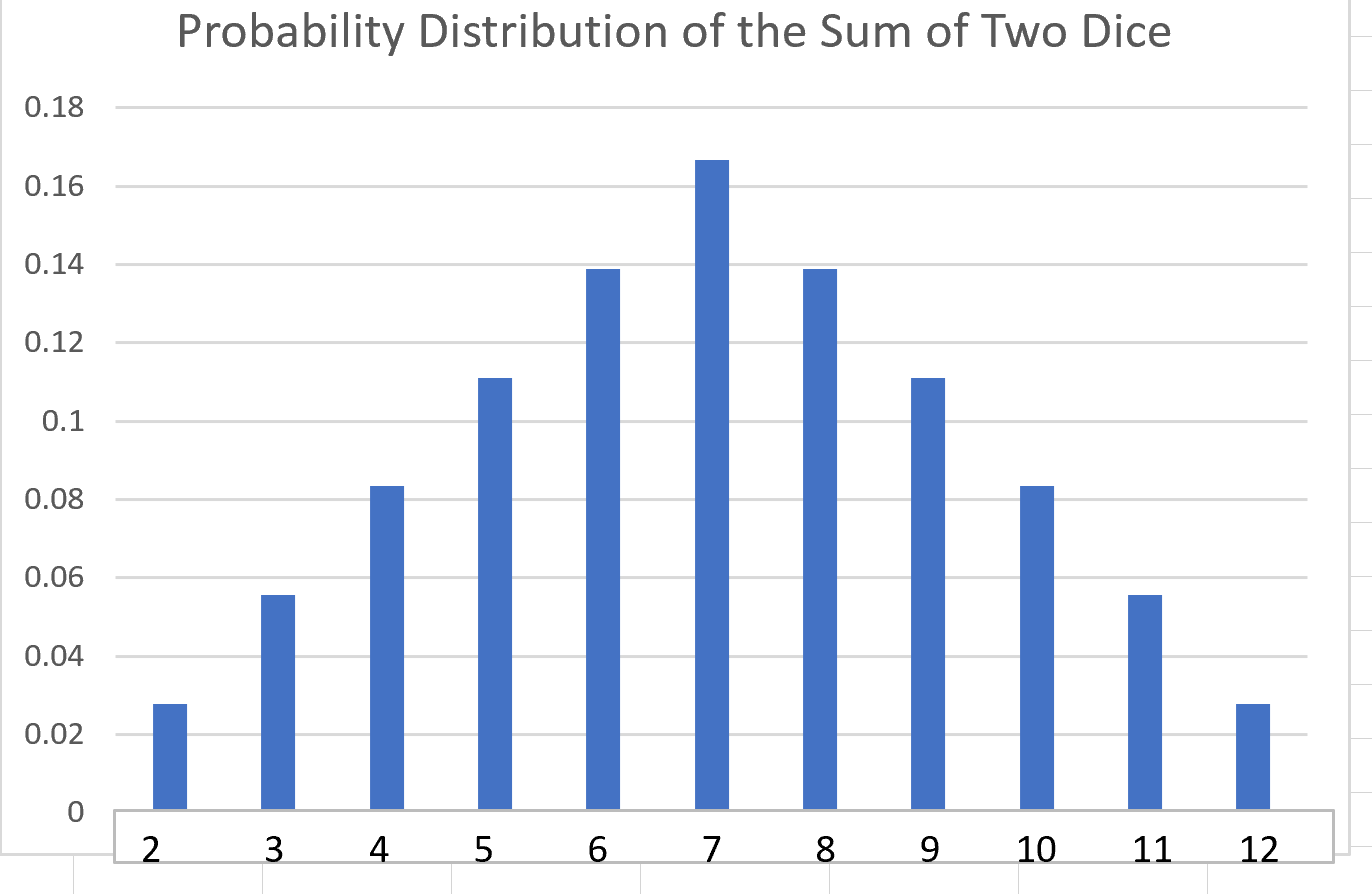
| x | P(x) |
|---|---|
| 2 | 1/36 |
| 3 | 2/36 |
| 4 | 3/36 |
| 5 | 4/36 |
| 6 | 5/36 |
| 7 | 6/36> |
| 8 | 5/36> |
| 9 | 4/36 |
| 10 | 3/36 |
| 11 | 2/36 |
| 12 | 1/36 |
| Sum of P(x)= 1.0 |
The probability distribution of the sum of the two dice is shown in the graph below:
Example 2
Probability Distribution of the Number of Switches:A switch occurs when tossing a coin many times and then count how many times you get a Head (H) followed by a Tail (H) or
a Trail followed by a Head. For example in TTHHTHTTTH, there are 5 switches in total.
Consider the following an example of probability distribution of the number of switches:
| x | P(x) |
|---|---|
| 0 | 0.2 |
| 1 | 0.1 |
| 2 | 0.2 |
| 3 | 0.1 |
| 4 | 0.3 |
| 5 | 0.1 |
| Sum of P(x) = 1.0 |
The probability distribution of the sum of the two dice is shown in the graph below:
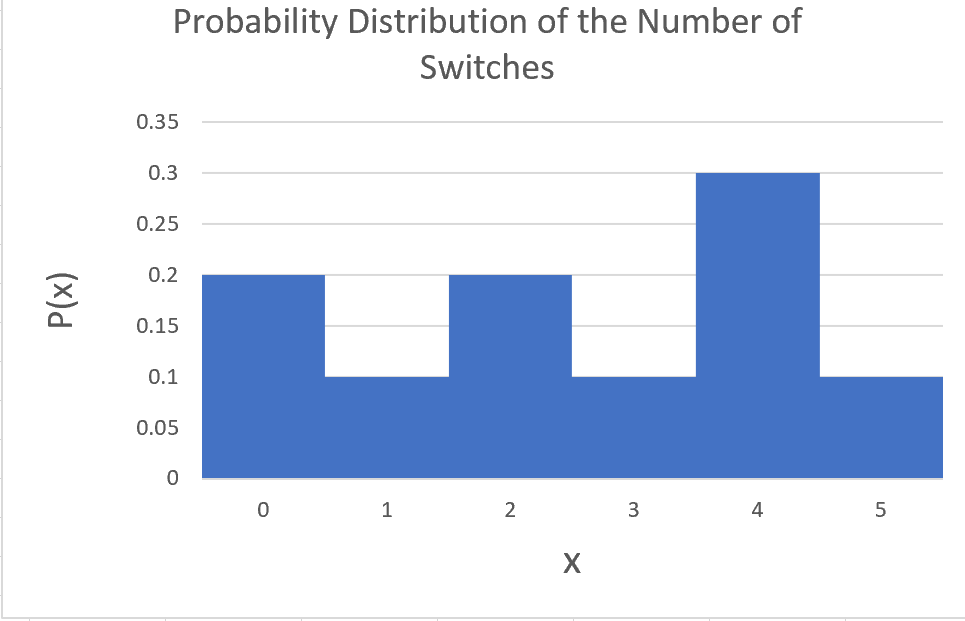
Probability of more than 2 switches P(X > 2) = P(3) + P(4) + P(5) = 0.2 + 0.1 + 0.1 = 0.4
Probability of at least 1 switch P(X ≥ 1) = 1 - P(0) = 1 - 0.1 = .9