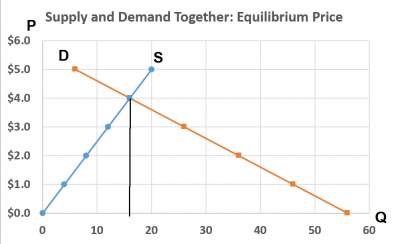
Both supply and demand curves are put drawn onto the same graph to find the Price P Equilibrium, which
is known when P has reached the level where quantity supplied equals quantity demanded. See figure below
Supply and Demand
What is Surplus?
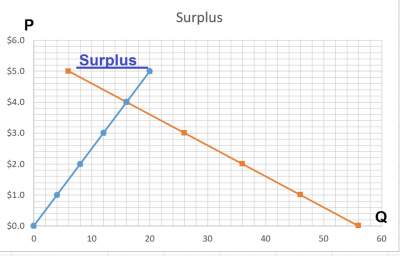
Excess of supply happens when quantity supplied is greater than quantity demanded.
Example 1
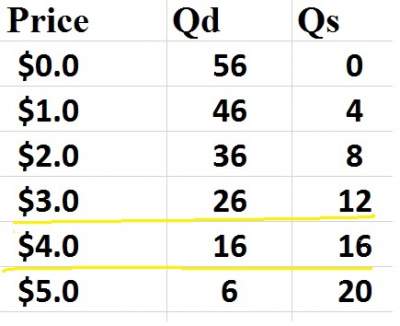
If P = $6 then Qd = 6 roses and Qs = 20 roses,
which leads to a surplus of 14 roses (see figure below).
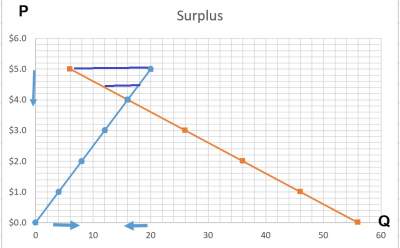
Whenever a surplus occurs, sellers will attempt to increase sales through cutting the current price.
This makes Qd go up and Qs to go down which lead us to reduce the surplus (see figure below).
Note that prices will continue to fall until market reaches equilibrium.
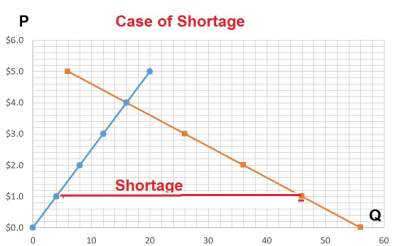
What is Shortage?
Shortage happens when quantity demanded is greater than quantity supplied.
Example 2
If P = $1 then Qd = 46 roses and Qs = 4 roses,
which leads to a shortage of 42 roses (see figure below).
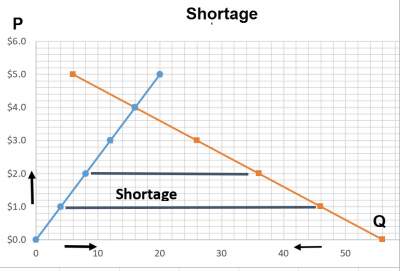
Whenever a shortage occurs, sellers will attempt to increase the price.
This makes Qd go down and Qs to go up which leads to reduce the shortage(see figure below).
Note that prices continue to increase until market reaches equilibrium.
Steps required to Analyze Changes in Equilibrium
To determine the effects of any event,
Pick whether event shifts S curve, curve, or both.
Pick in which direction curve shifts.
Use supply-demand diagram to see how the shift changes equilibrium P and Q.
Terms for Movement versus Shift Along Curve
Change in demand: a shift in the D curve happens when a non-price determinant of demand changes (like income or # of buyers)
Change in the quantity demanded: a movement along a fixed D curve
happens when P changes
Change in supply: a shift in the S curve happens when a non-price determinant of supply changes (like technology or costs)
Change in the quantity supplied: a movement along a fixed S curve
happens when P changes
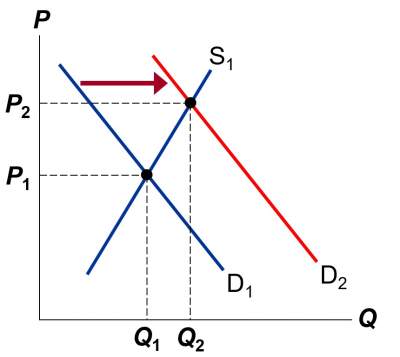
Example 3: A Shift in Demand
Event to be analyzed: Increase in price of gas in the case of hybrid cars
A Shift in Demand
D curve shifts due to the price of gas
D shifts right
The shift leads to an increase in price and quantity of hybrid cars.
Note that when price of gas goes uo, car producers supply larger quantity of hybrids, where the S curve has not shifted.
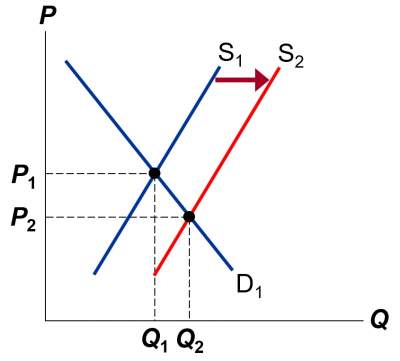
Example 4: A Shift in Supply
Event to be analyzed: New technology reduces cost of producing hybrid cars.
A Shift in Supply
S curve shifts
S shifts right
The shift causes price to decrease and quantity to increase.
Example 5: A Shift in both Supply & Demand
Events to be analyzed: price of gas increases AND new technology reduces production costs
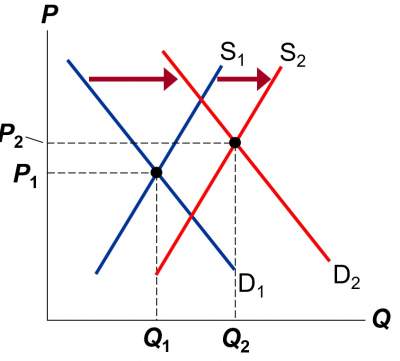
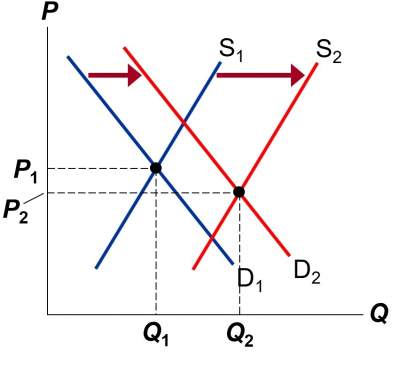
A Shift in both Supply & Demand
Both curves shift.
Both shift to the right.
Q increases, but effect on P is unclear: If demand increases more than supply, P increases.
However, if supply increases more than demand, then P decreases (see below).