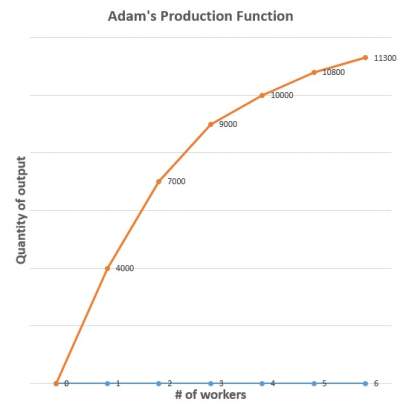
| L (# of workers) | Q (Kilograms of rice) |
|---|---|
| 0 | 0 |
| 1 | 4000 |
| 2 | 7000 |
| 3 | 9000 |
| 4 | 10000 |
| 5 | 10800 |
| 6 | 11300 |
| |
| L (# of workers) | Q (Kilograms of rice) | ΔL | ΔQ | MPL |
|---|---|---|---|---|
| 0 | 0 | |||
| 1 | 4000 | |||
| 1 | 4000 | 4000 | ||
| 2 | 7000 | |||
| 1 | 3000 | 3000 | ||
| 3 | 9000 | |||
| 1 | 2000 | 2000 | ||
| 4 | 10000 | |||
| 1 | 1000 | 1000 | ||
| 5 | 10800 | |||
| 1 | 800 | 800 | ||
| 6 | 11300 | |||
| 1 | 500 | 500 |
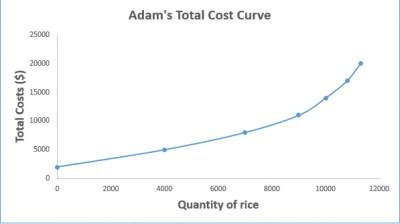
| L (# of workers) | Q (Kilograms of rice) | Cost of Land | Cost of Labor | Total Costs |
|---|---|---|---|---|
| 0 | 0 | $2000 | $0 | $2000 |
| 1 | 4000 | $2000 | $3000 | $5000 |
| 2 | 7000 | $2000 | $6000 | $8000 |
| 3 | 9000 | $2000 | $9000 | $11000 |
| 4 | 10000- | $2000 | $12000 | $14000 |
| 5 | 10800 | $2000 | $15000 | $17000 |
| 6 | 11300 | $2000 | $18000 | $20000 |
|  |
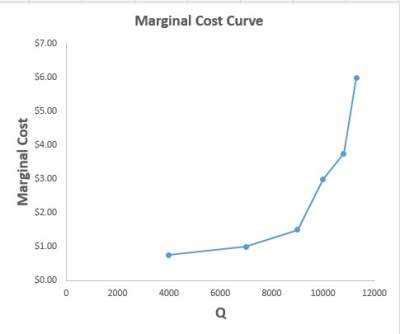
| Q (Kilograms of rice) | Total Cost | ΔQ | ΔTC | Marginal Cost (MC) |
|---|---|---|---|---|
| 0 | $2000 | |||
| 4000 | $5000 | |||
| 4000 | $3000 | $0.75 | ||
| 7000 | $8000 | |||
| 3000 | $3000 | $1.00 | ||
| 9000 | $11000 | |||
| 2000 | $3000 | $1.50 | ||
| 10000 | $14000 | |||
| 1000 | $3000 | $3.00 | ||
| 10800 | $17000 | |||
| 800 | $3000 | $3.75 | ||
| 11300 | $20000 | |||
| 500 | $3000 | $6.00 |
|  |