Markets & Competitions
Market
- A market is a group of buyers and sellers of a particular product.
- A competitive market is one with many buyers and sellers, each has a negligible effect on market price.
- In this unit, it is assumed that markets are perfectly competitive where:
- All goods are the same
- There are so many buyers and sellers to the point where no one can effect market price and each is price taker
Demand
- The quantity demanded of any good is the amount of the good that buyers are willing and able to purchase.
- Law of demand states that the quantity purchased varies inversely with price. Basically, if the price goes up, the quantity demanded goes down.
The Demand Schedule
Demand schedule
It is a table that shows the relationship between the price of a good and the quantity demanded.
Example: Mary's demand for tutoring.
Demand Schedule 1
Demand Schedule-1
Mary's Demand Schedule For Tutoring
| Price per Hour | # Hours of Tutoring per Month |
| $5 | 60 |
| $6 | 50 |
| $7 | 45 |
| $8 | 35 |
| $9 | 25 |
| $10 | 20 |
|
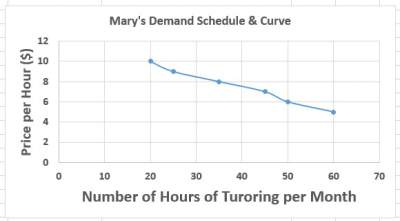 |
Note that Mary' preferences obey the Law of Demand.
Individual Demand versus Market Demand
- The quantity demanded in the market is the sum of the quantities demanded by all buyers at each price.
- For example, let's assume Mary and Joe are the only two tutoring providers in market. Here, Qd (quantity demanded)
Individual Demand versus Market Demand
| Price per Hour | Mary's Qd | | Joe's Qd | | Market Qd |
| $5 | 60 | + | 55 | = | 115 |
| $6 | 50 | + | 45 | = | 95 |
| $7 | 45 | + | 40 | = | 85 |
| $8 | 35 | + | 30 | = | 65 |
| $9 | 25 | + | 20 | = | 45 |
| $10 | 20 | + | 15 | = | 35 |
Note that in the above example, it clearly violates the "many buyers (service provider)" condition of
perfect competition. However, it is just a way to illustrate that at each price,
the amount of tutoring hours demanded in the market is the sum of the number of hours demanded by each buyer (service provider) in the market.
This holds whether there are two OR MORE buyers (service providers).
Individual Demand versus Market Demand 2
Individual Demand vs. Market Demand 2
| Price per Hour (P) | Market Qd |
| $5 | 115 |
| $6 | 95 |
| $7 | 85 |
| 8$ | 65 |
| $9 | 45 |
| $10 | 35 |
|
 |
For more details, please contact me here.