Introduction
We have seen that if Q represents the number of units sold or produced, then the total cost equation is TC = VC × Q + FCWe can draw a graph for the total costs. This is a linear equation and will give a straight line graph. We use the following steps:
Step 1: Draw the two axes. Label the horizontal axis as Q (number of units) and the vertical axis as TC (total costs in dollars).
It is impossible to sell or produce negative quantities. So we only use Q-values (number of units) and TC-values (dollars), which are positive.
The origin is at zero - zero units and zero dollars.
The capacity for the period is the maximum number of units that can be sold or produced. This value should be available.
To draw the total cost line, choose two x-values:
- Q = 0
- Q = the capacity for the period
Calculate the total cost when Q has the capacity value.
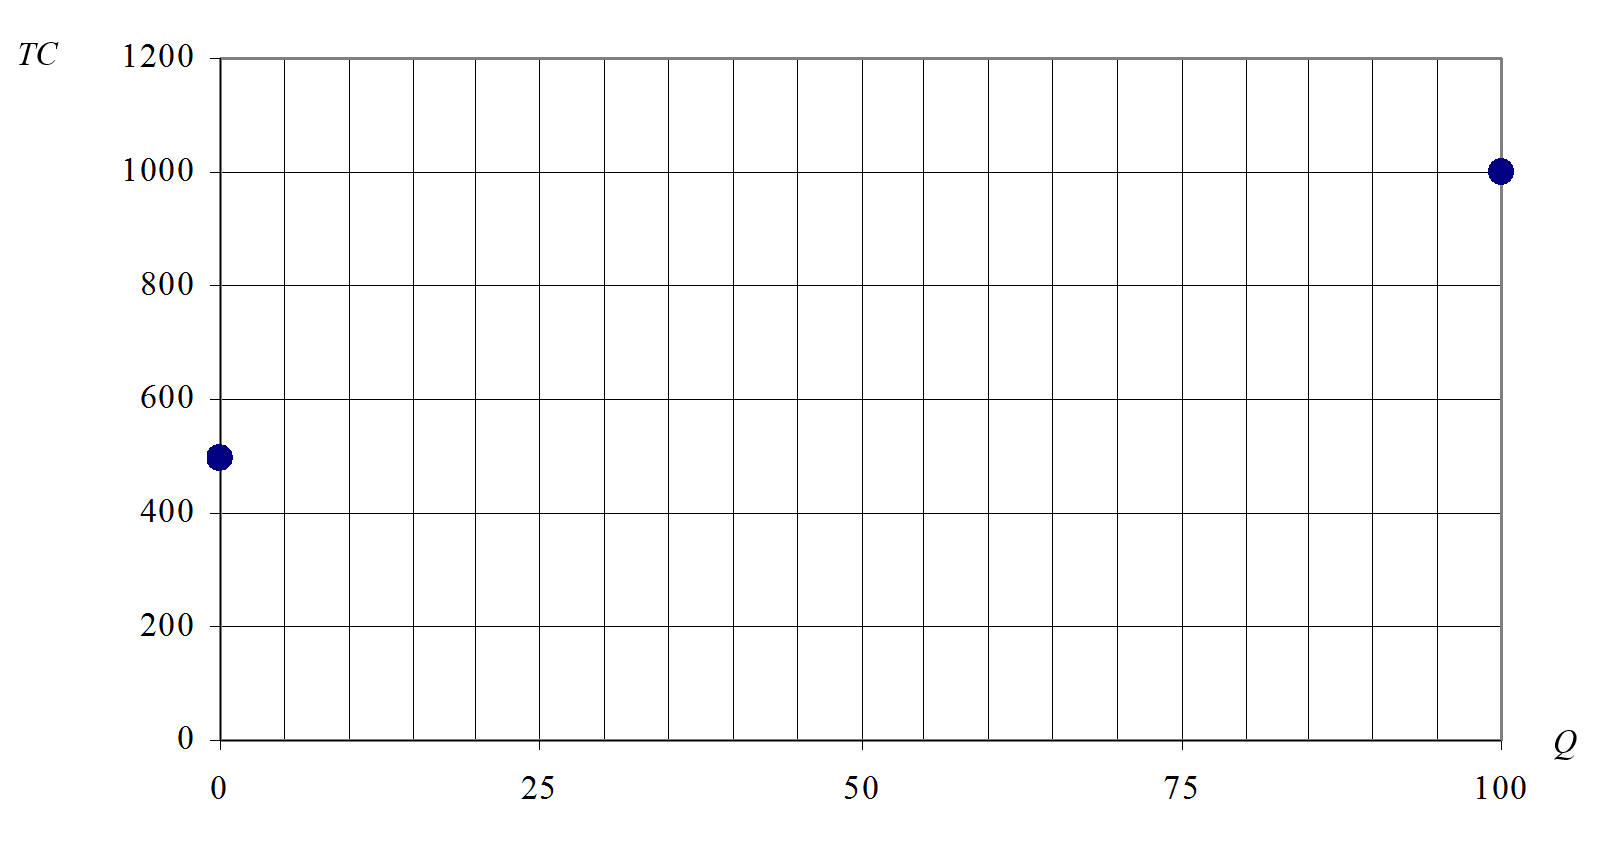
Step 2: Plot the point (0, FC) on the graph. When Q = 0, the total cost is FC.
Plot the point for the capacity and total cost found in Step 1.
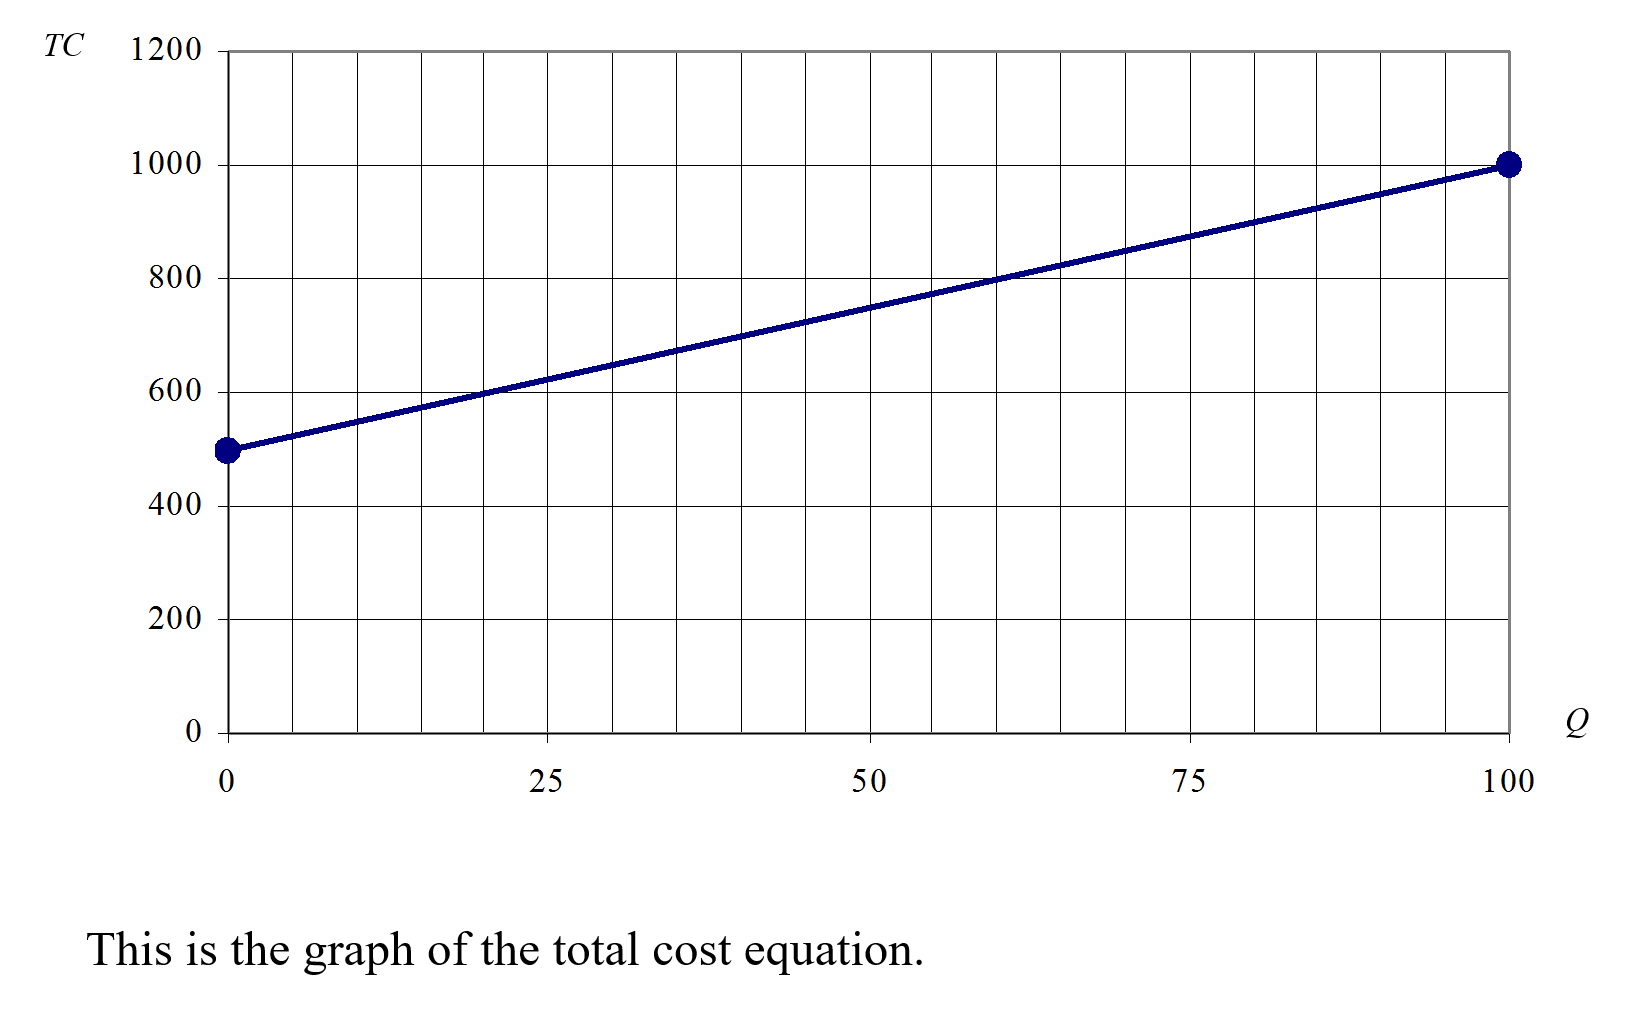
Step 3: Draw a straight line through the two plotted points for the total cost graph.
Examples
Example 1
Graph the total cost equation: TC = 30Q + 5000;The capacity for the period is 150 units.
Step 1: Draw the two axes. Label the horizontal axis as Q (number of units) and the vertical axis as TC (total cost in dollars).
To draw the total cost line, choose two x-values:
- Q = 0
- Q = 150
Calculate the total costs when Q has the capacity value.
| Q | TC |
|---|---|
| 0 | 30 × 0 + 5000 = 5000 |
| 150 | 30 × 150 + 5000 = 9500 |
Step 3: Draw a straight line through the two plotted points for the total cost graph. See the graph below:
Example 2
The graph below is a total cost graph. The capacity per period is 200. TC is in dollars.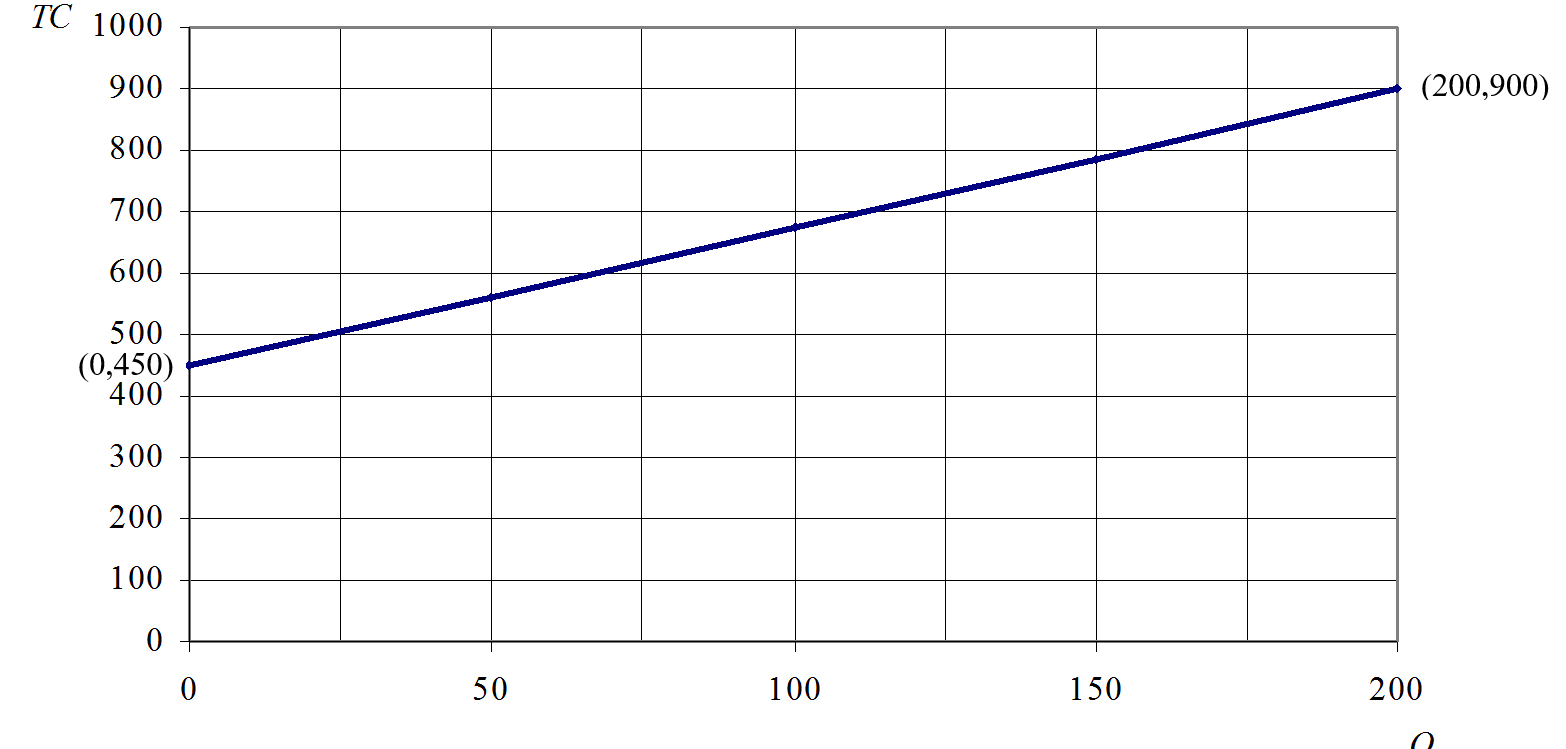
Question: Find the slope
Solution: The slope of the total cost line gives the unit variable costs. The two points on the line are (0, 450) and (200, 900).
a = (y2 − y1) / (x2 − x1) = (900 − 450) / (200 − 0) = 450 / 200 = 2.25
The unit variable costs (VC) are $2.25.
Question: Find the y-intercept.
Solution:
The y-intercept gives the fixed costs. We know that the fixed costs stay the same regardless of the number of units sold or produced.
y-intercept = b = FC = 450;
Question: Find the total cost equation:
Answer: The total cost equation is TC = VC × Q + FC = 2.25Q + 450
Extra Exercise
Please access the following link to do an additional exercise on total cost graph:Exercise on total cost graph