Introduction to Linear Equation Graph
Introduction
- The general equation is: Y = ax + b
-
- Y: Dependent Variable
- a: Slop
- x: Independent Varialbe
- b: Y-intercept
- Has a straight line graph
- Use the x-axis for the independent variable x
- Use the y-axis for the dependent variable y
Example:
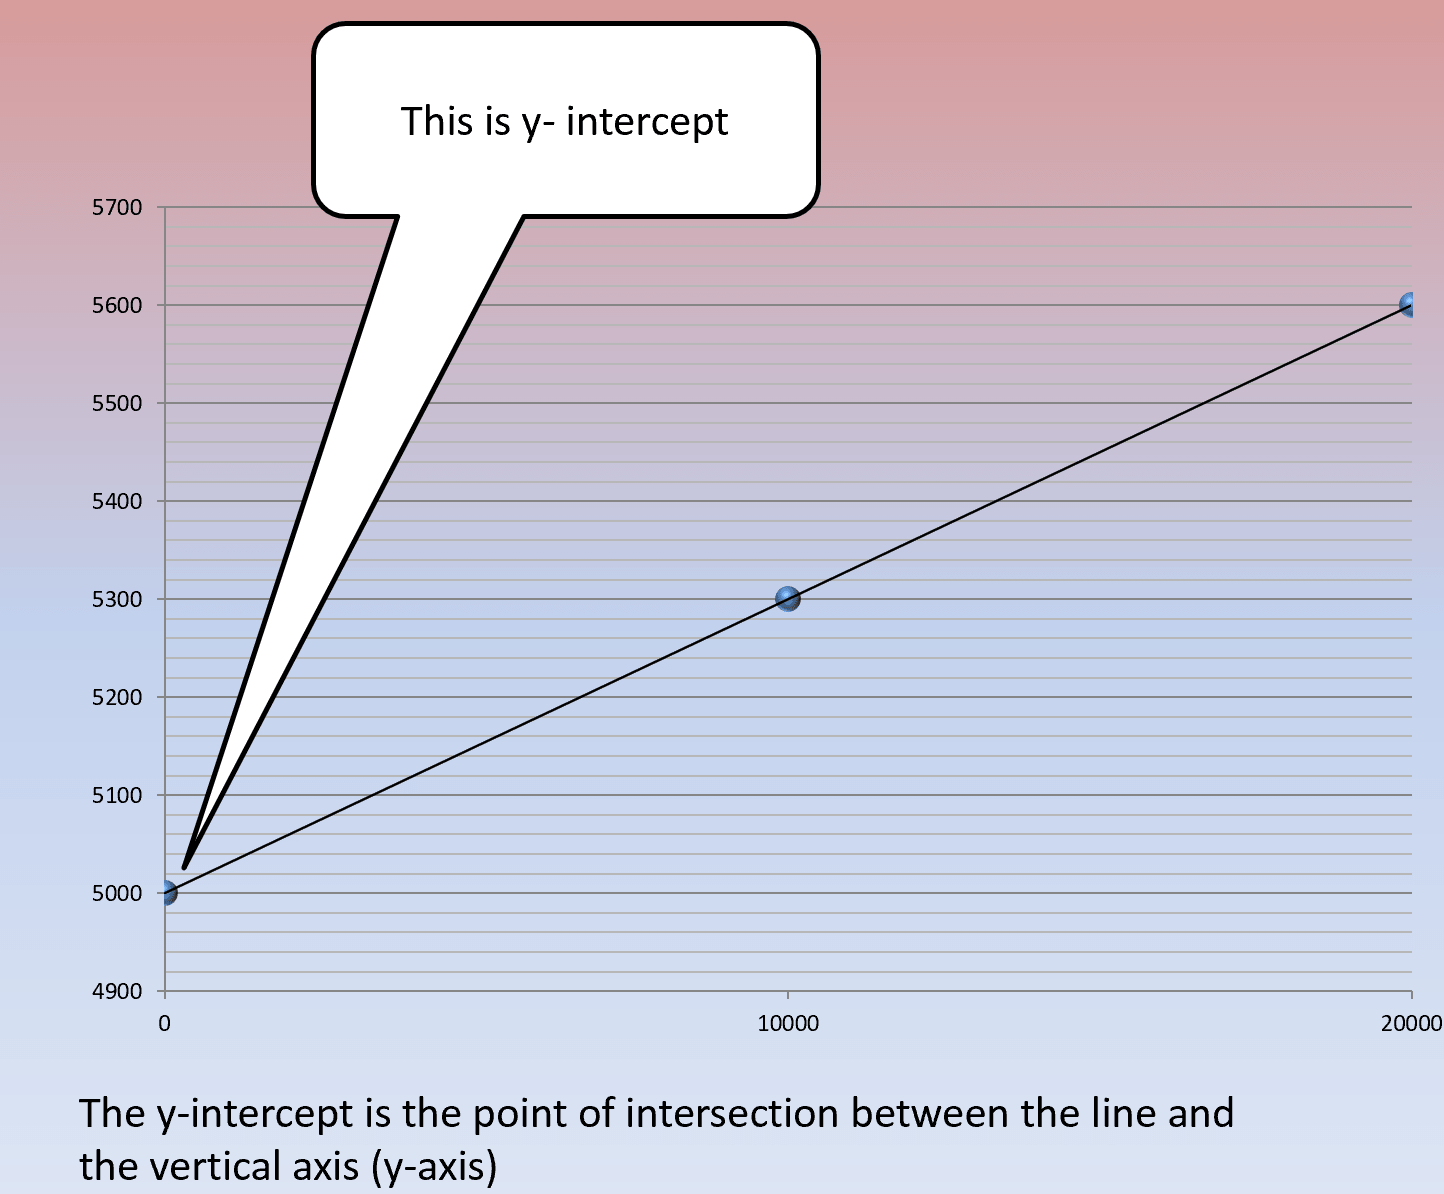
The monthly income of a salesmen is calculated from the equation: y = 0.03x + 5000
- Where x is the monthly sales, in dollars, and y is the monthly income, in dollars.
- Draw an accurate graph of this equation for x=0 to x= 20,000. use the horizontal axis for x and the vertical axis for y.
The following illustration depicts the y-intercept:
Slope
The slope is defined as follows:
- Is a measure of the direction of the line
- Positive slope = moving up line
- Negative slope = heading down line
- A slope of 0 (zero) = flat horizontal line
- Slope Formula : a = (y2 − y1) / (x2 − x1) = ∆y / ͧ0x
- (x1,y1) and (x2,y2) are only two points located on the line
- The slope measures the change in the dependent variable y for every change in the independent variable x
For more details, please contact me here.