Introduction
Statistics is a branch of mathematics, which involves:
- Collecting data
- Organizing and analyzing data
- Drawing conclusions from data
Population vs. Sample
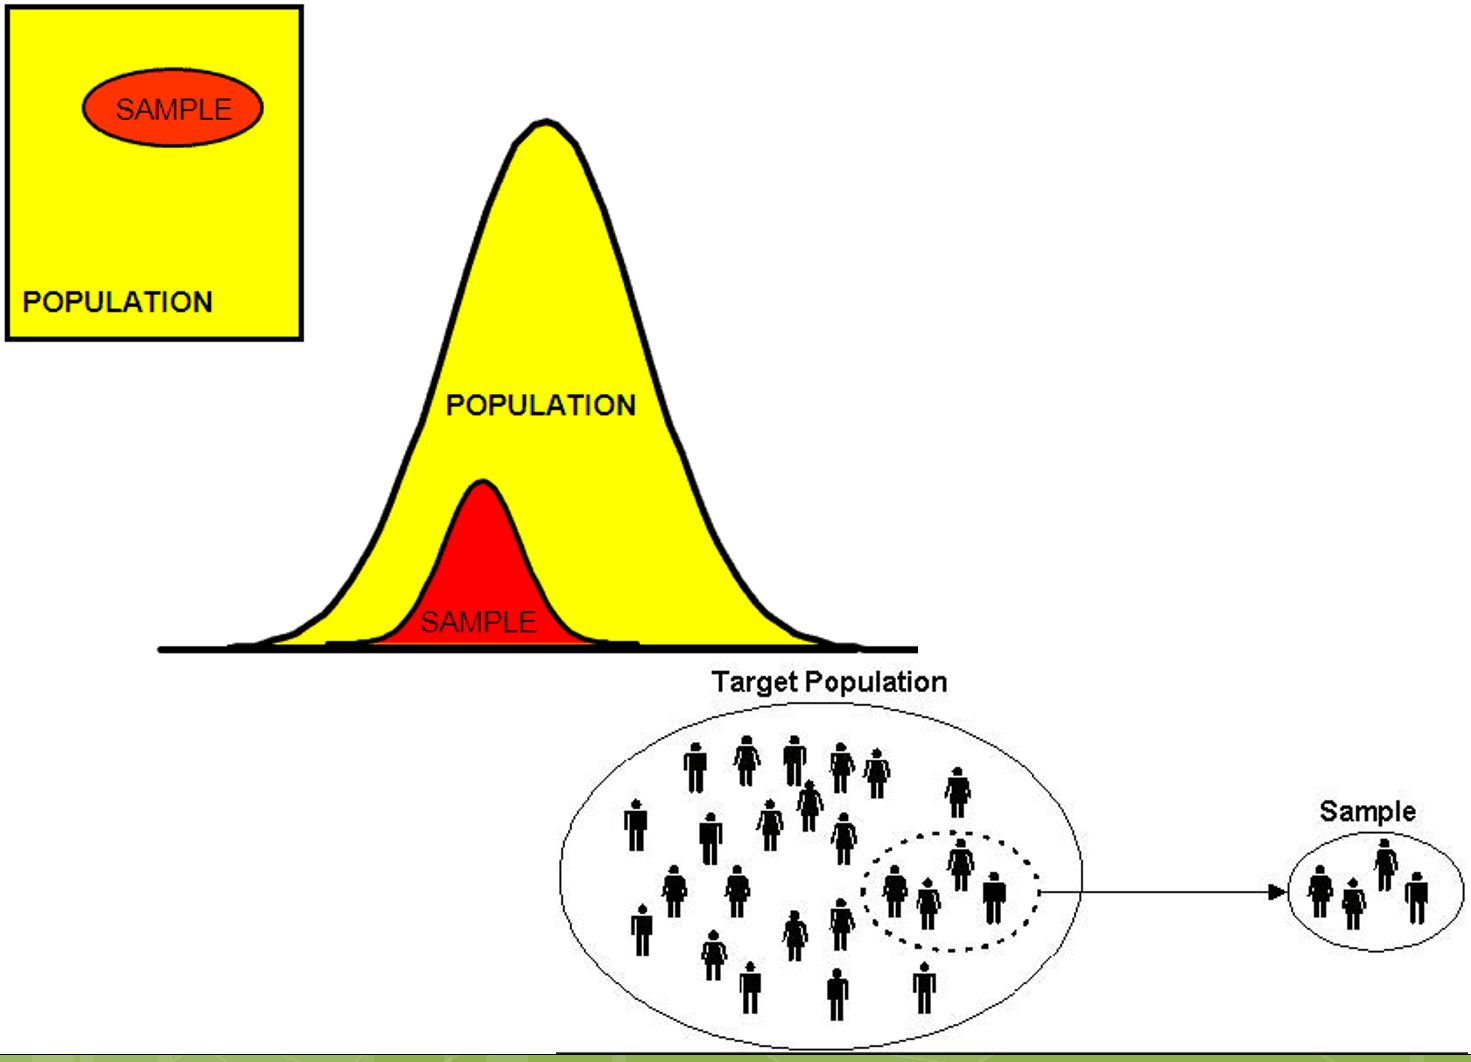
Population: The entire group of objects or individuals whose properties are to be analyzed. The population always contains all elements of the group that we would like to analyze.
Sample: A part or subset of the population used to gain information about the whole. See illustration below:

Descriptive and Inferential Statistics
Descriptive statistics is the science of:
- collecting data,
- classifying data, and
- summarizing data. In this course we shall learn some of the basic concepts of descriptive statistics.
If a researcher gathers data from a sample and uses the resulting statistics to reach conclusions about the parameters of the population from which the sample was taken,
the statistics are inferential statistics. See illustration below about two categories of statistics:

Classification of Data
Data can be classified into two broad types: qualitative and quantitative.
Qualitative date:
Example: Gender, occupation, nationality, and color They are not measured with a scale; they represent categories only.
Quantitative date:
Example: Ages, height, weight, speed, number of patients in a hospital. Numerical data can be manipulated by arithmetic expressions such as addtion and substration.
Variables
Variables may be discrete or continuous.
A discrete variable is a variable that can take only selected values.
Examples:
- The number of students in a class. There cannot be 20 and half students in the class, but there can be 20 or 21 students.
- The number of rooms in a house.
- A discrete variable is mostly the result of a count.
A continuous variable is one that can assume any value within a specified interval.
Examples:
- Height of a student in the class.
- the time required to complete a task
- weight of a shipment
- the profits or revenues of a company
- The height of a student cannot jump from 1.7 m to 1.8 meters
- It must assume every value between 1.5 m and 1.6 m at some time
A continuous variable is mostly the result of a measurement.

Now, it is time to answer simple questions then check your answers with the provided solutions.
For more details, please contact me here.
Date of last modification: March 5, 2019


