Explaining the Graphical Method
Introduction
From the previous section, we already know that:
NI = TR − TC
- If TR = TC, NI = 0 Break Even
- If TR >TC, NI > 0 Profit
- If TR <TC, NI < 0 Loss
The business will start making a profit when the total revenue gets bigger than the total costs.
Most businesses need to know the point at which they will begin making profit.
This point begins after they break even and is known as the break-even point.
We can find the break-even point using one of the following methods:
- Graphical method
- Algebraic method
- Unit Contribution Margin Method
The Graphical Method
We can find the break-even point using graphs. We do this by plotting the total revenue graph and the total cost graph on the same axes.
The point where the graphs cross (the point of intersection) is where: Total Revenue = Total Costs and this shows the break-even point.
We use the following steps to find the break-even point graphically:
Here are the steps following to do the breakdown analysis graphically:
- Find the Total Revenue (TR) equation. Draw it.
- Find the Total Cost (TC) equation. Draw it
- Find the intersection point of the two lines graphs (TR=TC). This is the breakeven point
- Draw a vertical line from this point to the horizontal axis to find the breakeven point in units
- Draw a horizontal line from this point to the vertical axis to find the breakeven point in dollars
Example
Zoho Enterprises makes genuine leather jackets. The variable costs to make each jacket are $90.
Fixed costs for the period are $3900. The selling price is $150 per jacket.
The factory's production capacity for the period is 100 jackets.
Question: Find the break-even point in units and in dollars.
Solution:
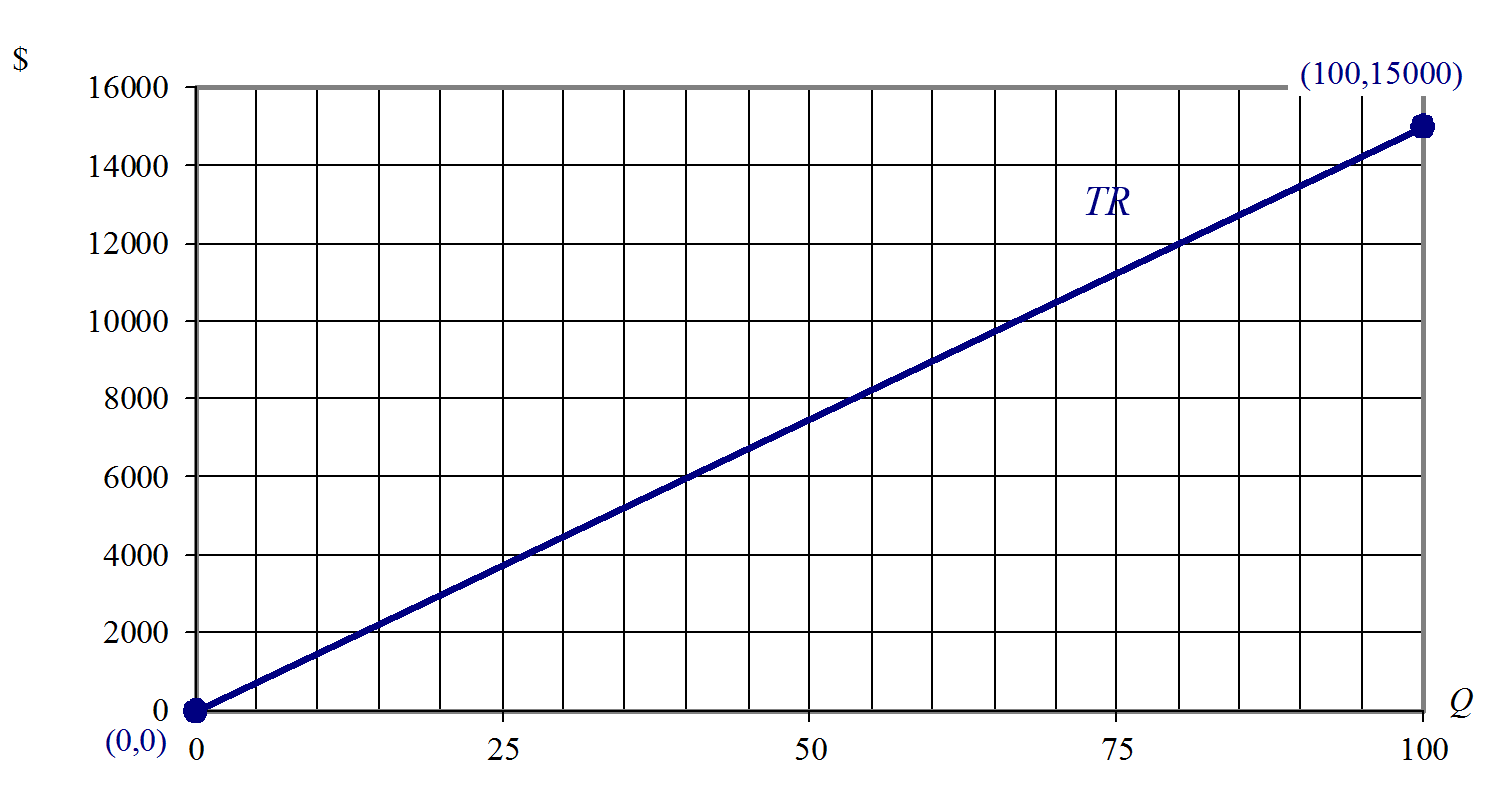
Step 1: Find the TR equation. TR = 150Q.
Step 2: Find the TC equation. TC = TVC + FC; TVC = 90Q; FC = 3900; TC = 90Q + 3900
Step 3: Draw a straight-line graph of total revenue (TR) equation.
For the table of values points choose the two Q-values: Q = 0; Q = the capacity for the period.
The capacity for the period is the maximum number of units that can be sold or produced. This value should be available.
| Q |
TR |
| 0 |
150 × 0 = 0 |
| 100 |
150 × 100 = 15000 |
The straight-line graph of total revenue (TR) equation is shown below:
Step 4: Draw a straight-line graph of total cost (TC) equation on the same axes.
| Q |
TC |
| 0 |
90 × 0 + 3900 = 3900 |
| 100 |
90 × 100 + 3900 = 12900 |
The break even analysis is shown in the graph below:
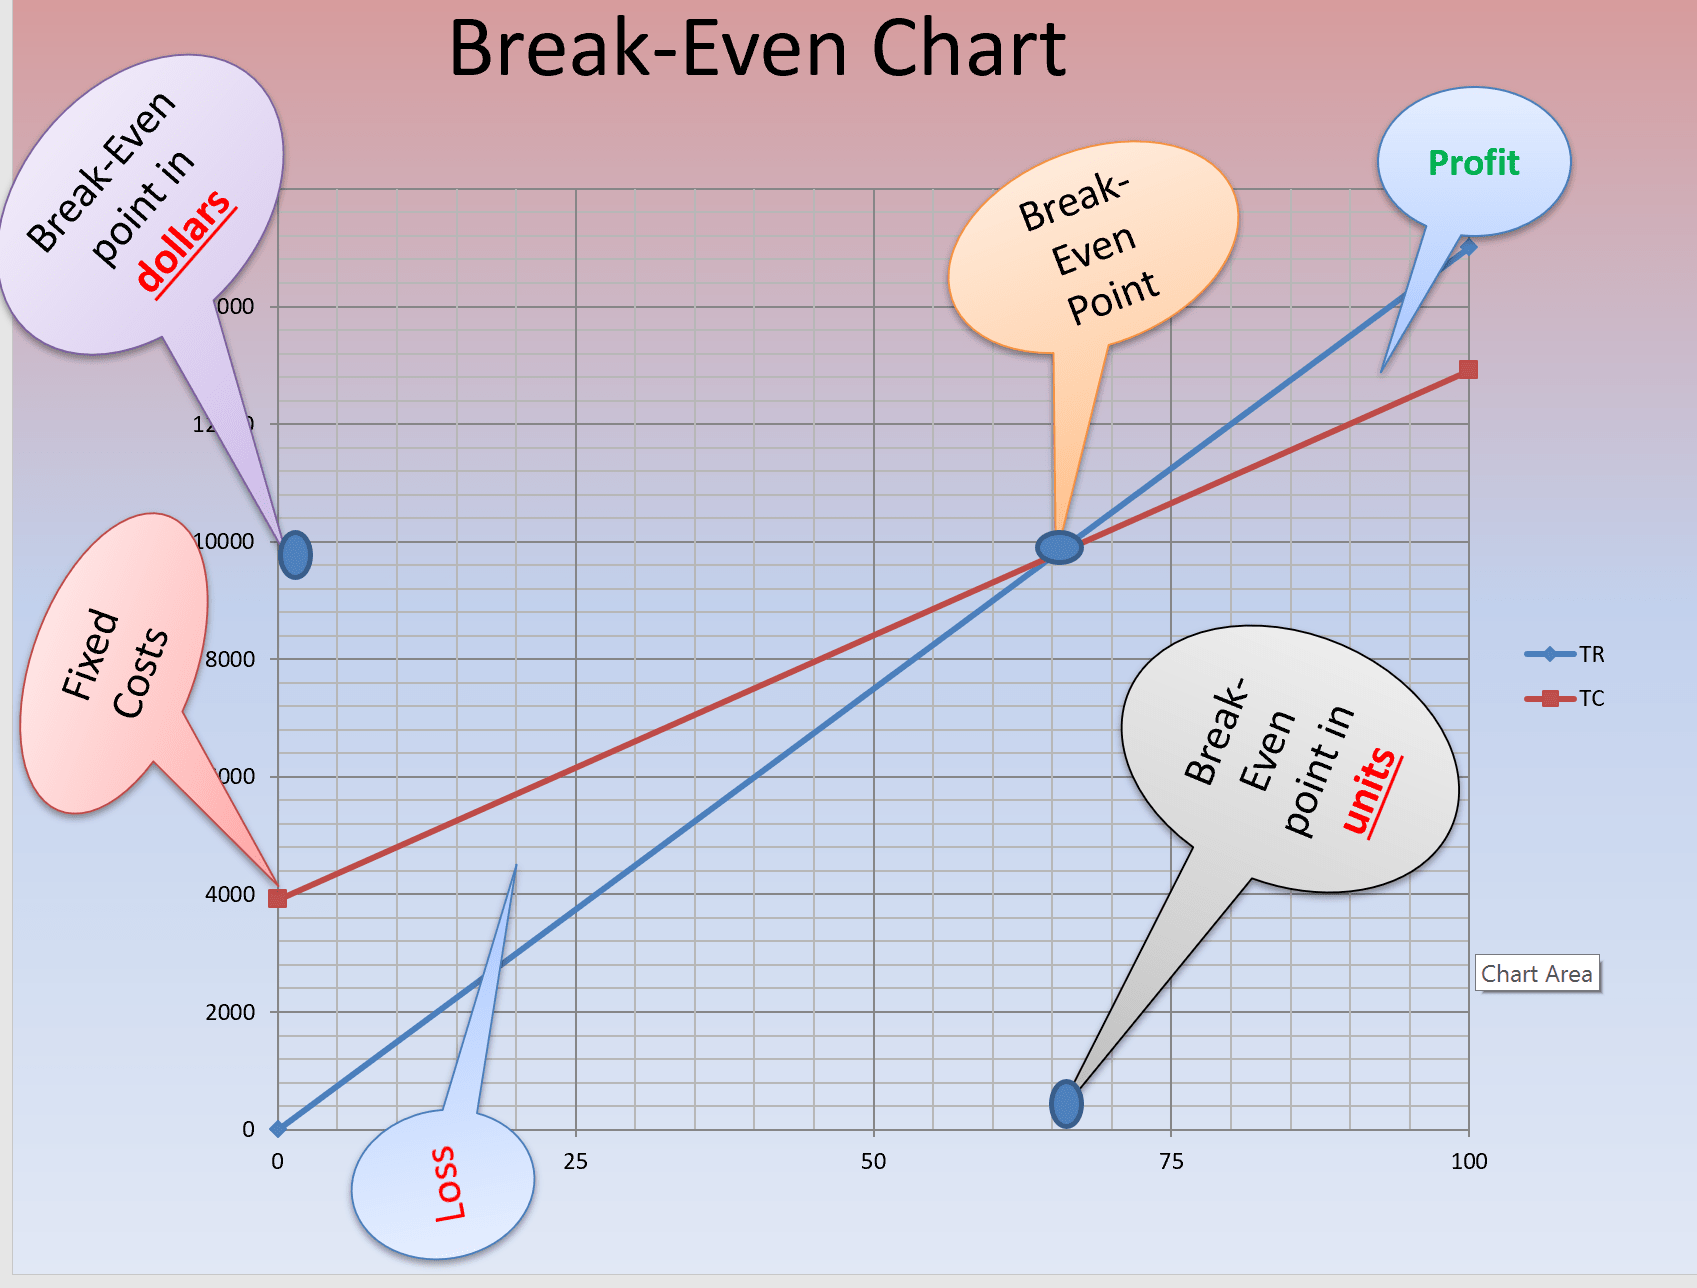
This graph below is called the break-even chart:
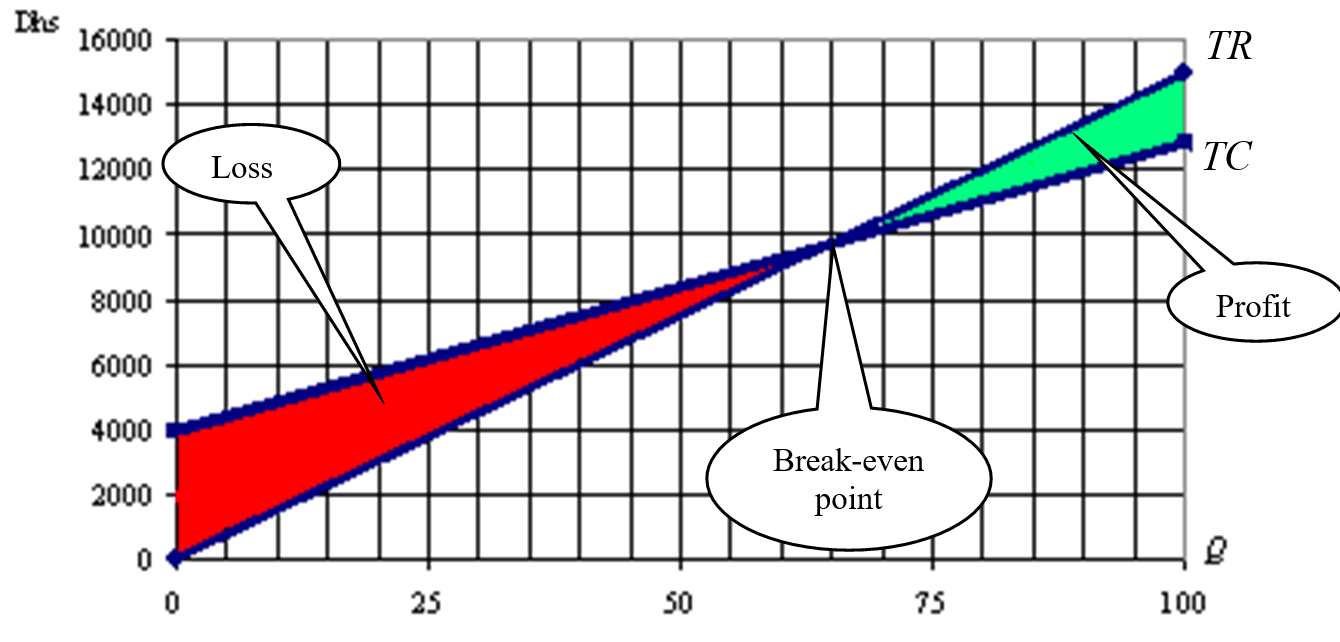
- In the break-even chart any point in the area between the two lines below the break-even point shows a loss.
- Any point in the area between the two lines above the break-even point shows a profit.
- At the break-even point, there is no loss or profit.
Please access the following link to do the same exercise using Excel:
break-even-excel
Please access the following link to do a similar exercise about break-even analysis:
break-even exercise
For more details, please contact me here.