Examples of Change in Variable Costs
Introduction to the Impact of Change in Variable Costs
In these examples, a special focus is on the effects of changes in variable costs on the net income and break-even point.
We will employ graphs which can help us to anakyse the break-even point.
We use the graph illustrating the total revenue and the total cost graphs within a break-even chart.
This chart becomes in turn a simple visual tool to analyze the financial position of a business using various number of units
sold such as sales volume or produced i.e. volume of output.
The amount of profit or loss is displayed which is generated for different levels of sales verus production.
Change in Variable Costs
A change in the variable costs will cause a change in the total variable costs and the total cost equation.
An increase in the variable costs will cause an increase in the total costs;
the TC graph will have a greater slope. A decrease in the variable costs will cause a decrease in the total costs;
the TC graph will have a smaller slope.
The higher the variable costs, the higher the level of the break-even point and the lower the profit level provided
that the other variables stay the same.
Example:
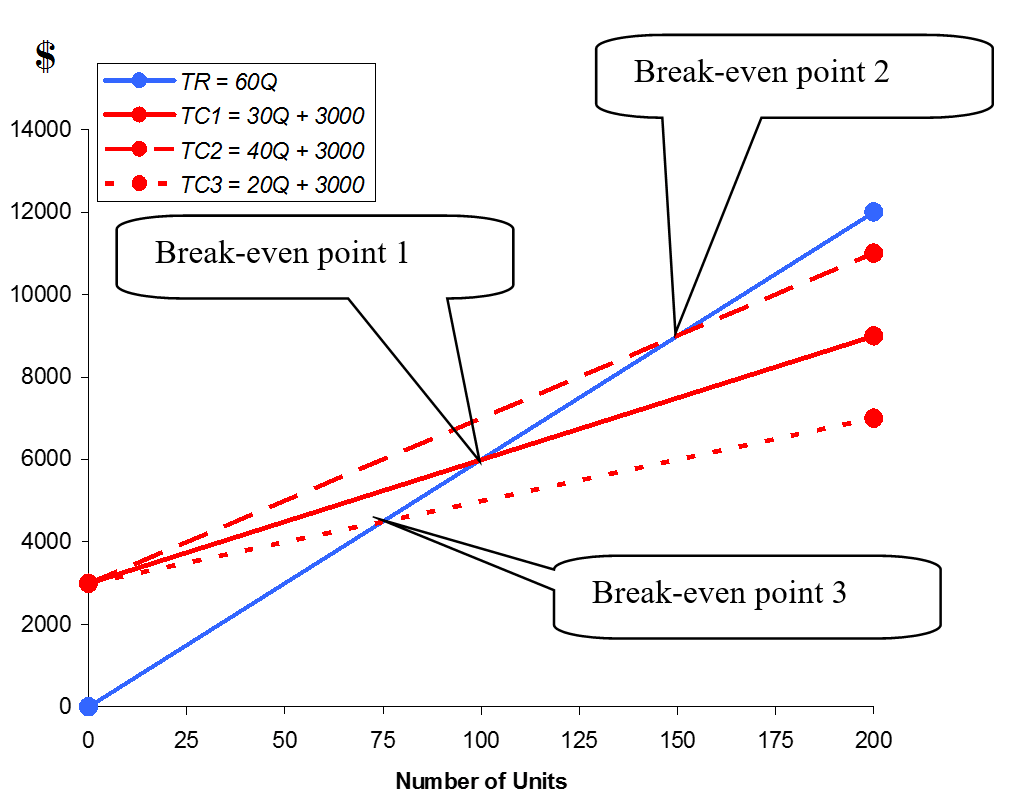
The graph shows the effect of an increase in the variable costs. TR is the total revenue graph as shown below:

The TC1 graph has a slope of 30. The variable costs (slope of line) = $30 per unit. Its equation is TC1 = 30Q + 3000.
The TC2 graph has a slope of 40. The variable costs (slope of line) = $40 per unit. Its equation is TC2 = 40Q + 3000.
The break-even point is higher for TC2. Note that the fixed costs are unchanged (same intercept on the vertical axis).
The TC3 graph has a slope of 20. The variable costs (slope of line) = $20 per unit.
Its equation is TC3 = 20Q + 3000. The break-even point is lower for TC3.
Note that the fixed costs are unchanged (same intercept on the vertical axis).
Please access the following link to do a similar exercise about change in variable cost:
Change in variable cost with solution
For more details, please contact me here.
