How to Analyze Graphical Models
Analyzing Given Models Graphically
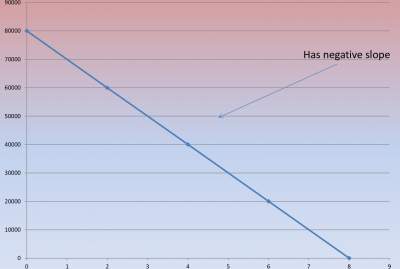
The depreciation in the value of a car is given by the following equation Y = -10000x + 80000
Where x is the age of the car, in years and y is the value of the car, in dollars.

This example has a negative slope as depicted in the figure below:
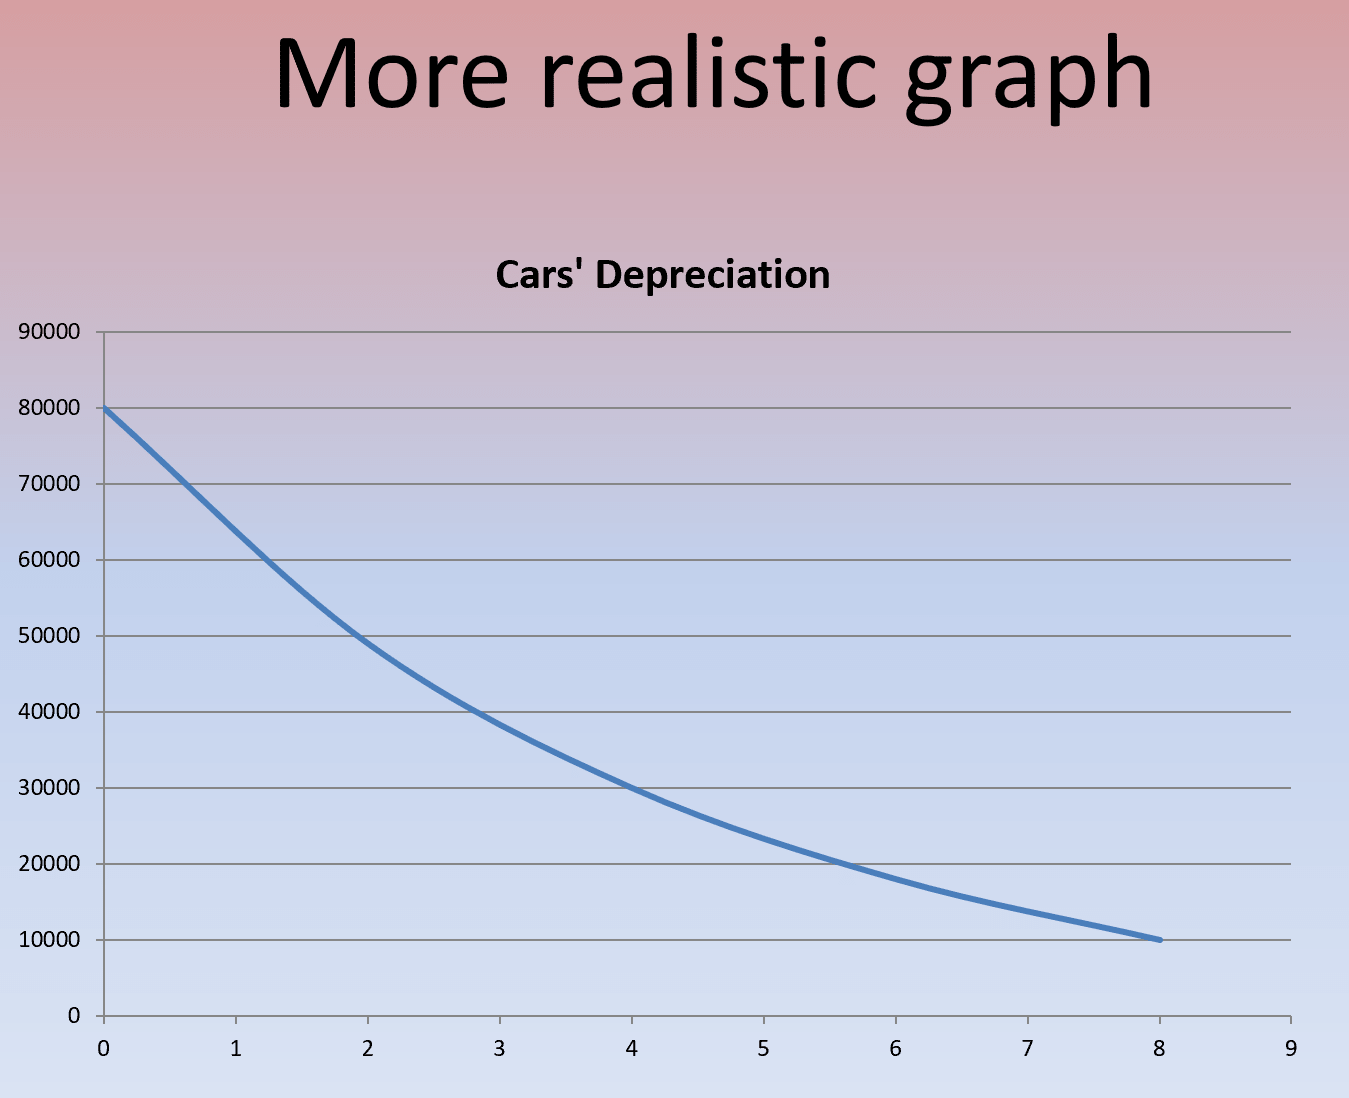
However, a more realistic graph is shown below:
Examples
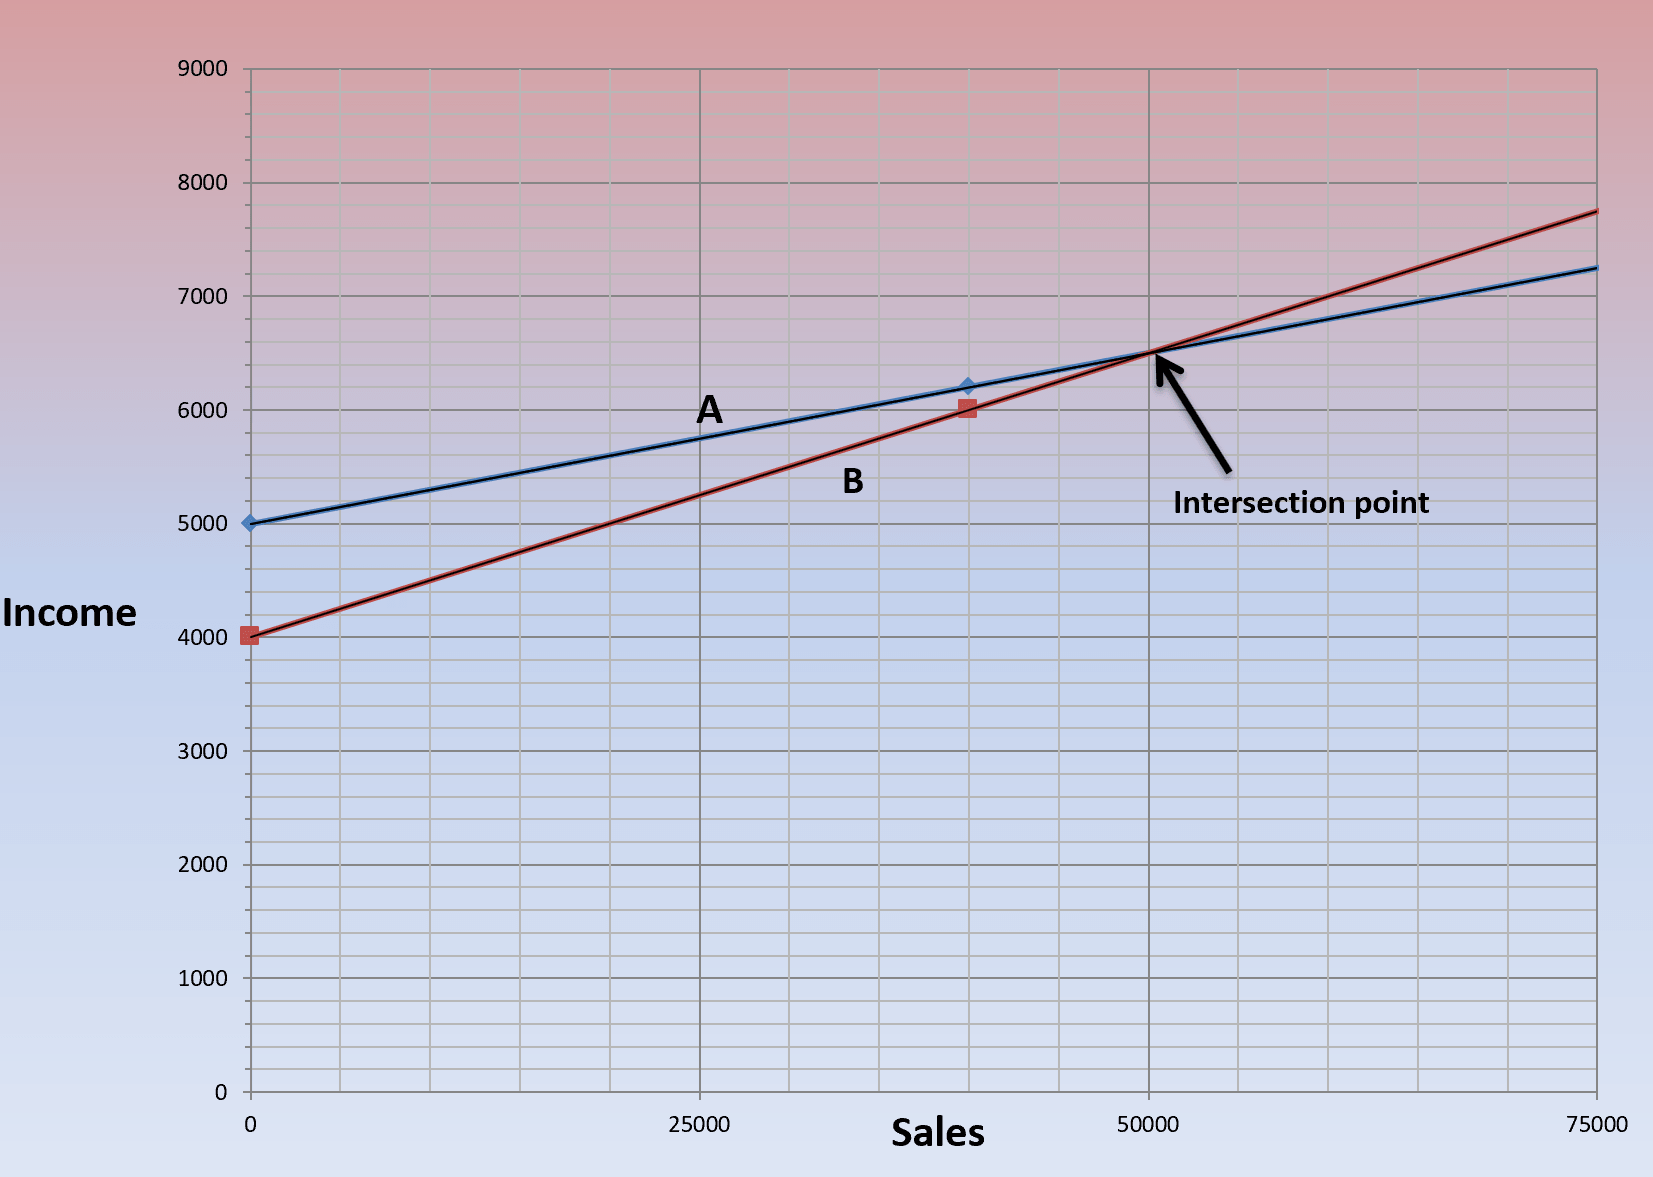
Example 1: Two salesmen work for the same company. Their monthly incomes are calculated as follows:
Salesmen A: Y = 0.03x + 5000; Salesman B: Y = 0.05x + 4000
Where in each case x is the monthly sales, in dirhams and y is the monthly income, in dollars.
Question: Draw an accurate graph for x=0 to R=80000
Example 2:
The graph below shows the depreciation for three brands of cars: Grand, Bitu, and Creep
The horizontal t-axis shows the age of the car, in years, and the vertical V-axis gives the value of the car, in dollars.
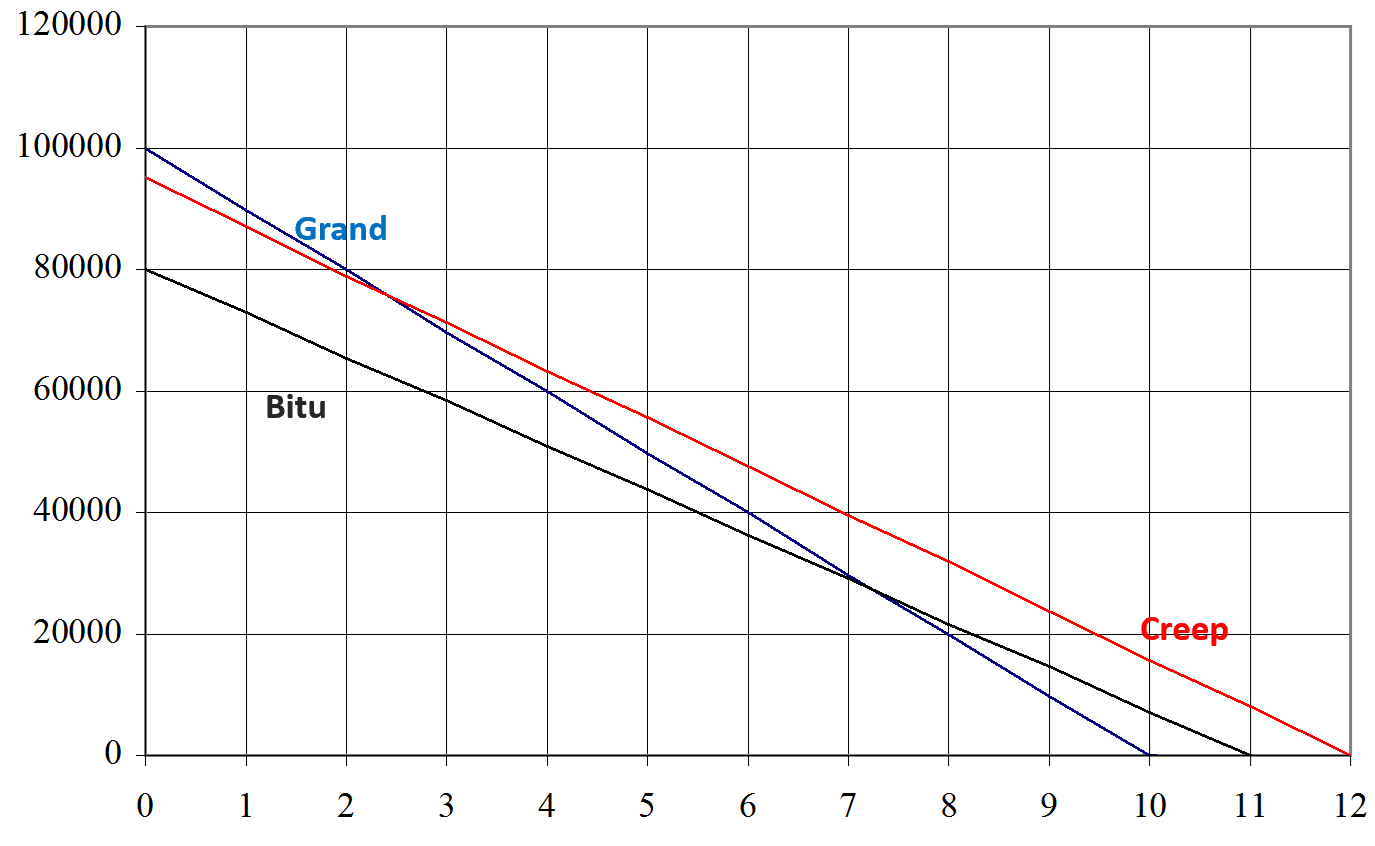
From the above, it is possible to answer the following question:
- Use the graph to order the values of cars after for example 10 years from lowest to highest.
- After how many years does the value of the Creep first go below $40,000?
Exercise with Solution
Please access the following link to do a similar exercise about change in variable cost:
Excel Solution: Analysis of Graphical Models
For more details, please contact me here.